For any sales pro or high performer

Know your numbers.
Know your next move.

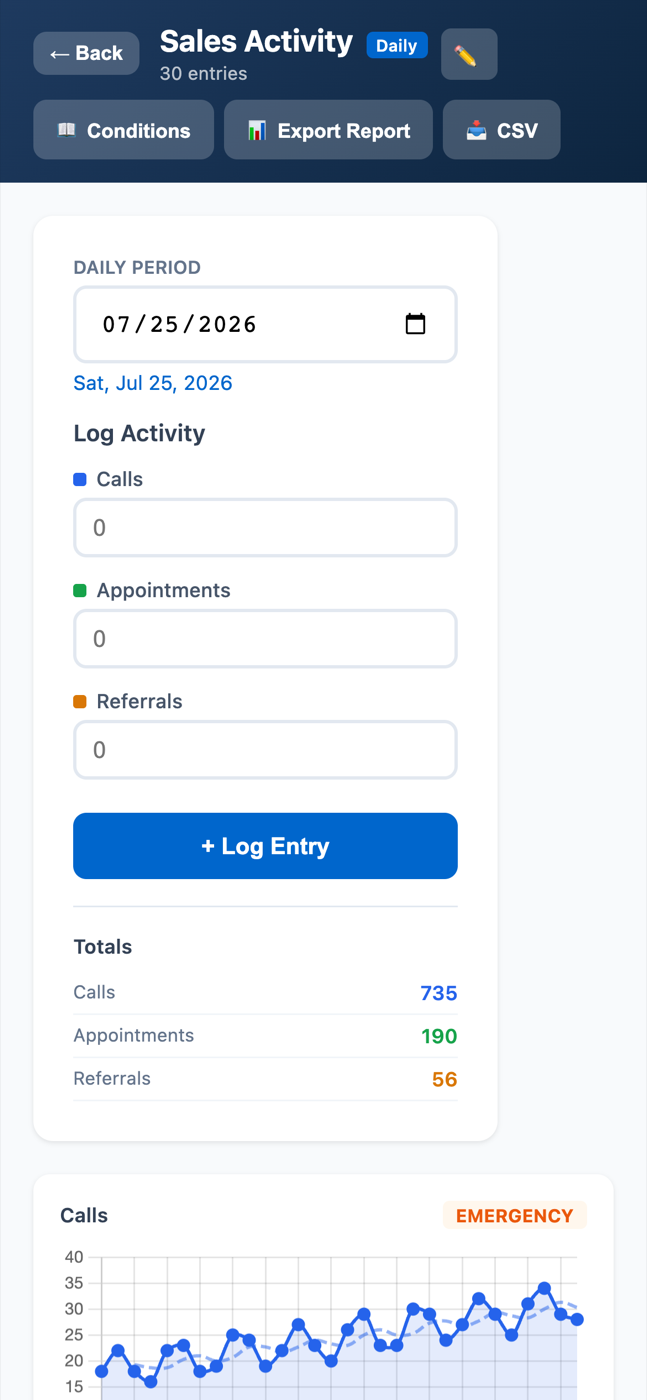
Graph the stats that drive your results, on whatever cadence you work. Every metric gets an automatic trend read and a concrete action checklist — so you always know what to do next, not just what the number is.

Free to start. Pro is $6.99/mo. Cancel anytime.

How It Works

Graph. Trend. Action.

Most trackers stop at the graph. This one tells you what the graph means — and what to do about it.

Log your stats

Pick the metrics that matter — calls, appointments, proposals, closes, whatever you count — and log them on any cadence, from daily to annually. Missed a log? Backdate it.

The app reads the trend

No squinting at a line and guessing. The app classifies each metric's current trend automatically, every time you log.

You get the play

Each trend comes with a concrete, step-by-step action checklist to improve it. Work the steps, log again, watch the line move.

The Difference

A graph tells you what happened. This tells you what's next.

Plenty of apps will chart your activity. Then they leave you staring at a line, deciding for yourself whether it's fine or a fire.

Activity Tracker does the reading for you. After every entry you get a debrief: how much the number changed, which way it's trending, and how far you've worked through the action steps for that trend.

You stop guessing and let your numbers tell you what to work on next.

My Week — Sales Activity
Calls made
84 this week · 312 running total
▲ Trending up
Appointments set
11 this week · 41 running total
▶ Holding steady
Proposals sent
3 this week · 19 running total
▼ Trending down
Next steps
Action checklist ready for Proposals sent

Illustration — track your own metrics, your own names, your own cadence.

Features

Everything you need to keep score on yourself.

Track anything, your way

🎯

Custom trackers and metrics

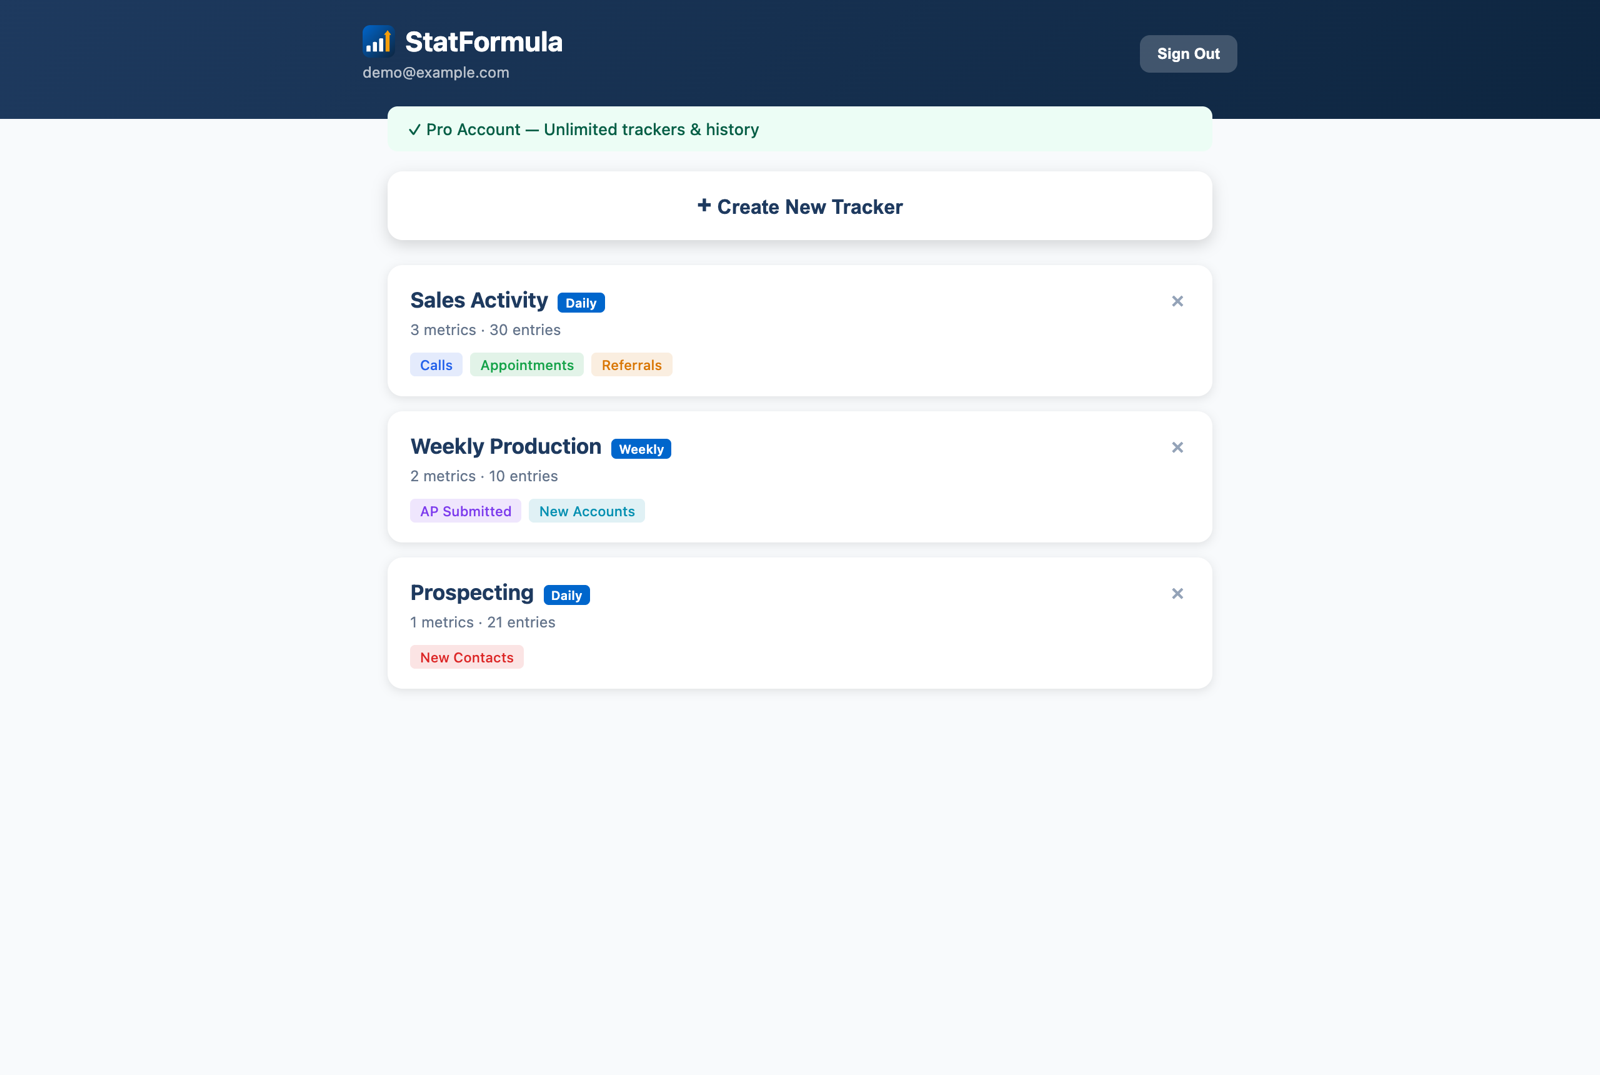
Build trackers around your own metric categories, with your own colors. Your numbers, your names.

🗓️

Six cadences, backdating included

Log daily, weekly, bi-weekly, monthly, quarterly, or annually. Backdated entries supported — a missed day doesn't break your record.

📈

Line graphs and running totals

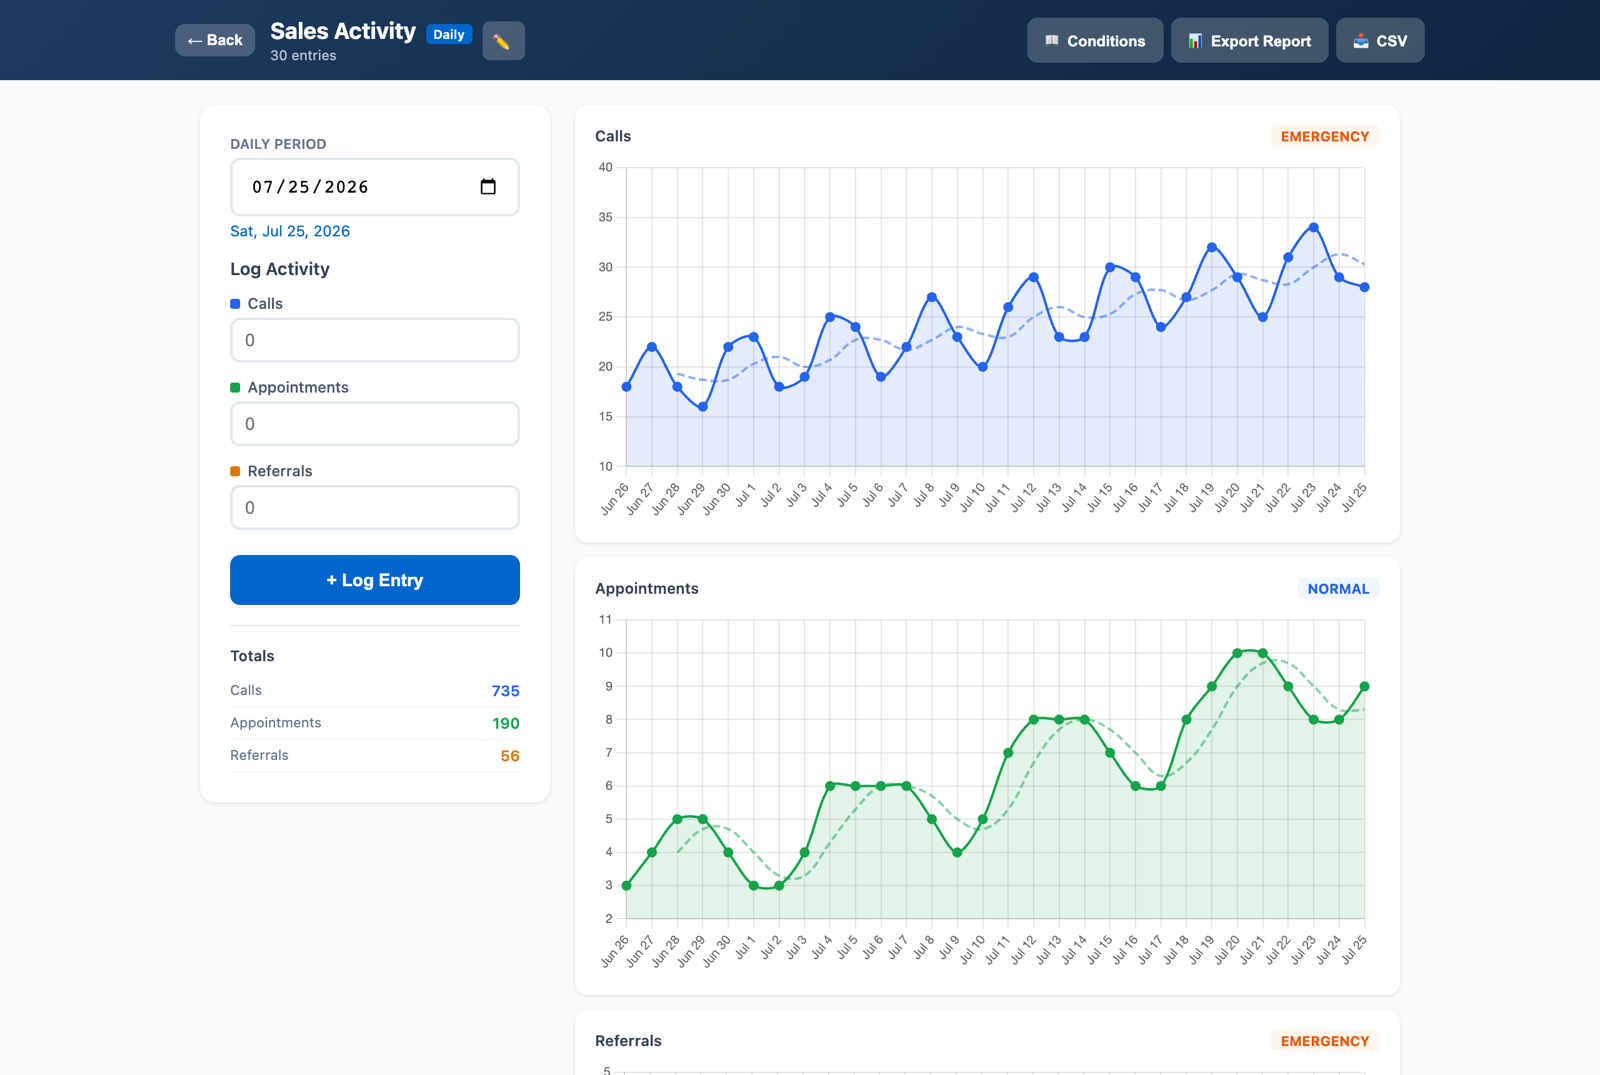
Every metric gets its own line graph, running total, and a full history table.

🧭

Post-entry debrief

After each log: your change percentage, the trend classification, and your progress through the action steps.

Take it everywhere

📤

Exports on Pro

Export your data as CSV, or generate shareable PNG report cards for your manager, your mentor, or your fridge door.

☁️

Cloud sync across devices

Sign in with email and password. Log on your phone in the field, review on your laptop at night.

📱

Installable, works offline

Add it to your phone's home screen like a native app — no app store — and keep logging even without a signal.

Pricing

Start free. Go Pro for $6.99 a month.

No contracts, no sales calls. Cancel anytime.

Free

$0
  • 1 custom tracker
  • Last 30 days of history
  • Log on any of the six cadences
  • Automatic trend reads and action checklists
Start free

Pro

$6.99/mo
  • Everything in Free
  • Unlimited trackers
  • Full history — no 30-day cap
  • CSV exports and shareable PNG report cards
Go Pro

Month-to-month. Cancel anytime.

FAQ

Quick answers.

Do I need to install anything?

No. It runs in your browser — create an account and start logging. If you want it on your phone like a native app, add it to your home screen; it installs as a web app with no app store involved.

Can I track weekly instead of daily?

Yes. Each tracker logs on the cadence you choose: daily, weekly, bi-weekly, monthly, quarterly, or annually. And backdated entries are supported, so a missed week doesn't leave a hole in your graph.

Does it work offline?

Yes. Install it on your phone and it works offline, so you can log in the field. With your cloud account, your data syncs across your devices.

What happens to my data if I downgrade from Pro?

Your data stays — nothing is deleted. The free tier shows your last 30 days of history and one tracker. Go Pro again and your full history is right where you left it.

Is this only for insurance people?

No. It's built for any sales pro or high performer who wants to run on numbers — you define the metrics, so it tracks whatever you count. (It also works great for insurance agents tracking personal production.)
Stop guessing. Start graphing.

Free to start, $6.99/mo when you outgrow one tracker. Your first entry takes about a minute.

Cancel anytime.